☁ Insights from Data with BigQuery: Challenge Lab (COVID-19 Open Data) | logbook

In this article, we will go through the lab GSP322 Insights from Data with BigQuery: Challenge Lab, which is an expert-level exercise on Qwiklabs. You will practice BigQuery for the data analysis of the COVID-19 open dataset bigquery-public-data.covid19_open_data.covid19_open_data.
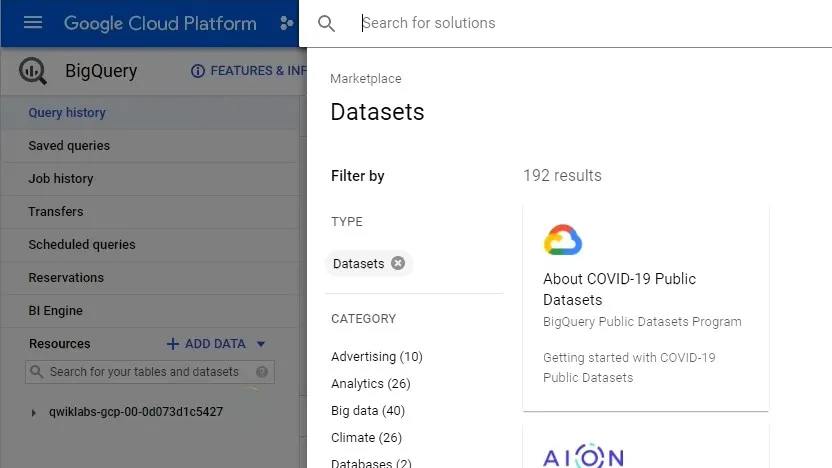
Open Public Dataset
- In the Cloud Console, navigate to Menu > BigQuery.
- Click + ADD DATA > Explore public datasets from the left pane.
- Search
covid19_open_dataand then select COVID-19 Open Data - Use Filter to locate the table
covid19_open_dataunder thecovid19_open_datadataset.


Query 1: Total Confirmed Cases

Copy the following code to the Query editor and then click Run.
SELECT
  SUM(cumulative_confirmed) AS total_cases_worldwide
FROM
  `bigquery-public-data.covid19_open_data.covid19_open_data`
WHERE
  date = "2020-04-15"
This query sums up the cumulative confirmed cases of all records on 15 April 2020.
Query 2: Worst Affected Areas

Copy the following code to the Query editor and then click Run.
SELECT
    COUNT(*) AS count_of_states
FROM (
SELECT
    subregion1_name AS state,
    SUM(cumulative_deceased) AS death_count
FROM
  `bigquery-public-data.covid19_open_data.covid19_open_data`
WHERE
  country_name="United States of America"
  AND date='2020-04-10'
  AND subregion1_name IS NOT NULL
GROUP BY
  subregion1_name
)
WHERE death_count > 100
Make sure that you use country_name to filter the US reconds instead of country_code, and use subregion1_name to group the states in the US.
Query 3: Identifying Hotspots

Copy the following code to the Query editor and then click Run.
SELECT
  *
FROM (
SELECT
  subregion1_name as state,
  sum(cumulative_confirmed) as total_confirmed_cases
FROM
  `bigquery-public-data.covid19_open_data.covid19_open_data`
WHERE
  country_code="US"
  AND date='2020-04-10'
  AND subregion1_name is NOT NULL
GROUP BY
  subregion1_name
ORDER BY
  total_confirmed_cases DESC
)
WHERE
  total_confirmed_cases > 1000
💬 Thanks Random32543654e474362 for providing the update of Query 3.
  SELECT
    subregion1_name AS state,
    SUM(cumulative_confirmed) AS total_confirmed_cases
FROM
    `bigquery-public-data.covid19_open_data.covid19_open_data`
WHERE
    country_name="United States of America"
    AND date = "2020-04-10"
GROUP BY subregion1_name
HAVING total_confirmed_cases > 1000
ORDER BY total_confirmed_cases DESCQuery 4: Fatality Ratio

Copy the following code to the Query editor and then click Run.
SELECT SUM(cumulative_confirmed) AS total_confirmed_cases, SUM(cumulative_deceased) AS total_deaths, (SUM(cumulative_deceased)/SUM(cumulative_confirmed))*100 AS case_fatality_ratio
FROM `bigquery-public-data.covid19_open_data.covid19_open_data`
WHERE country_name="Italy" AND date BETWEEN "2020-04-01" AND "2020-04-30"
Originally, it should be date='2020-04-30'. I don’t know why Qwiklabs replaced it with a date range.
Query 5: Identifying specific day

Copy the following code to the Query editor and then click Run.
SELECT
 date
FROM
  `bigquery-public-data.covid19_open_data.covid19_open_data`
WHERE
 country_name = 'Italy'
 AND cumulative_deceased > 10000
ORDER BY date
LIMIT 1
Make sure that you use ORDER BY to sort the results by date.
Query 6: Finding days with zero net new cases

Copy the following code to the Query editor and then click Run.
WITH india_cases_by_date AS (
  SELECT
    date,
    SUM(cumulative_confirmed) AS cases
  FROM
    `bigquery-public-data.covid19_open_data.covid19_open_data`
  WHERE
    country_name="India"
    AND date between '2020-02-21' and '2020-03-15'
  GROUP BY
    date
  ORDER BY
    date ASC
 )

, india_previous_day_comparison AS
(SELECT
  date,
  cases,
  LAG(cases) OVER(ORDER BY date) AS previous_day,
  cases - LAG(cases) OVER(ORDER BY date) AS net_new_cases
FROM india_cases_by_date
)
SELECT
  COUNT(date)
FROM
  india_previous_day_comparison
WHERE
  net_new_cases = 0
Query 7: Doubling rate

Copy the following code to the Query editor and then click Run.
WITH us_cases_by_date AS (
  SELECT
    date,
    SUM( cumulative_confirmed ) AS cases
  FROM
    `bigquery-public-data.covid19_open_data.covid19_open_data`
  WHERE
    country_name="United States of America"
    AND date between '2020-03-22' and '2020-04-20'
  GROUP BY
    date
  ORDER BY
    date ASC
 )

, us_previous_day_comparison AS
(SELECT
  date,
  cases,
  LAG(cases) OVER(ORDER BY date) AS previous_day,
  cases - LAG(cases) OVER(ORDER BY date) AS net_new_cases,
  (cases - LAG(cases) OVER(ORDER BY date))*100/LAG(cases) OVER(ORDER BY date) AS percentage_increase
FROM us_cases_by_date
)
SELECT
  Date,
  cases AS Confirmed_Cases_On_Day,
  previous_day AS Confirmed_Cases_Previous_Day,
  percentage_increase AS Percentage_Increase_In_Cases
FROM
  us_previous_day_comparison
WHERE
  percentage_increase > 10
Query 8: Recovery rate

Copy the following code to the Query editor and then click Run.
WITH cases_by_country AS (
  SELECT
    country_name AS country,
    SUM(cumulative_confirmed) AS cases,
    SUM(cumulative_recovered) AS recovered_cases
  FROM
    `bigquery-public-data.covid19_open_data.covid19_open_data`
  WHERE
    date="2020-05-10"
  GROUP BY
    country_name
)

, recovered_rate AS (
  SELECT
    country, cases, recovered_cases,
    (recovered_cases * 100)/cases AS recovery_rate
  FROM
    cases_by_country
)

SELECT country, cases AS confirmed_cases, recovered_cases, recovery_rate
FROM
   recovered_rate
WHERE
   cases > 50000
ORDER BY recovery_rate DESC
LIMIT 10
Query 9: CDGR - Cumulative Daily Growth Rate

Copy the following code to the Query editor and then click Run.
WITH
  france_cases AS (
  SELECT
    date,
    SUM(cumulative_confirmed) AS total_cases
  FROM
    `bigquery-public-data.covid19_open_data.covid19_open_data`
  WHERE
    country_name="France"
    AND date IN ('2020-01-24',
      '2020-05-10')
  GROUP BY
    date
  ORDER BY
    date)
, summary as (
SELECT
  total_cases AS first_day_cases,
  LEAD(total_cases) OVER(ORDER BY date) AS last_day_cases,
  DATE_DIFF(LEAD(date) OVER(ORDER BY date),date, day) AS days_diff
FROM
  france_cases
LIMIT 1
)

select first_day_cases, last_day_cases, days_diff, POWER(last_day_cases/first_day_cases,1/days_diff)-1 as cdgr
from summary
Create a Datastudio report

-
Copy the following code to the Query editor and then click Run.
SELECT date, SUM(cumulative_confirmed) AS country_cases, SUM(cumulative_deceased) AS country_deaths FROM `bigquery-public-data.covid19_open_data.covid19_open_data` WHERE date BETWEEN '2020-03-15' AND '2020-04-30' AND country_name='United States of America' GROUP BY date - Click on EXPLORE DATA > Explore with Data Studio.
- Authorize Data Studio to access BigQuery.
- You may fail to create a report for the first-time login of Data Studio. Click + Blank Report and accept the Terms of Service. Go back to the BigQuery page and click Explore with Data Studio again.
- In the new Data Studio report, select Add a chart > Time series Chart.
- Add
country_casesandcountry_deathsto the Metric field. - Click Save to commit the change.
If you fail to get the score of this task, remove all data and reports from the Datastudio console before retry.
Congratulations! You completed this challenge lab.
Demonstration Video
This browser does not support the YouTube video player. Watch on YouTube
⏱Timestamps:
00:00 Start Lab
00:30 Open "COVID-19 Open data" public dataset
01:34 Query 1: Total Confirmed Cases
03:10 Query 2: Worst Affected Areas
07:07 Query 3: Identifying Hotspots
09:17 Query 4: Fatality Ratio
12:30 Query 5: Identifying specific day
13:19 Query 6: Finding days with zero net new cases
14:47 Query 7: Doubling rate
18:25 Query 8: Recovery rate
24:36 Query 9: CDGR - Cumulative Daily Growth Rate
25:32 Create a Datastudio report
References:
Keep on reading:
